部署cert-manager
# kubectl apply -f https://github.com/cert-manager/cert-manager/releases/download/v1.17.4/cert-manager.yaml
# kubectl get pod -n cert-manager
NAME                                       READY   STATUS    RESTARTS   AGE
cert-manager-6d54964b8f-wrtmw              1/1     Running   0          80s
cert-manager-cainjector-5b7d5cb8cb-wxhcb   1/1     Running   0          80s
cert-manager-webhook-c46c6d97c-zt6jg       1/1     Running   0          80s
部署 opentelemetry-operator.yaml
# kubectl apply -f  https://github.com/open-telemetry/opentelemetry-operator/releases/latest/download/opentelemetry-operator.yaml
# kubectl get po -n opentelemetry-operator-system
NAME                                                        READY   STATUS    RESTARTS   AGE
opentelemetry-operator-controller-manager-c664f5df9-2d9l4   2/2     Running   0          37s
部署 opentelemetry collector
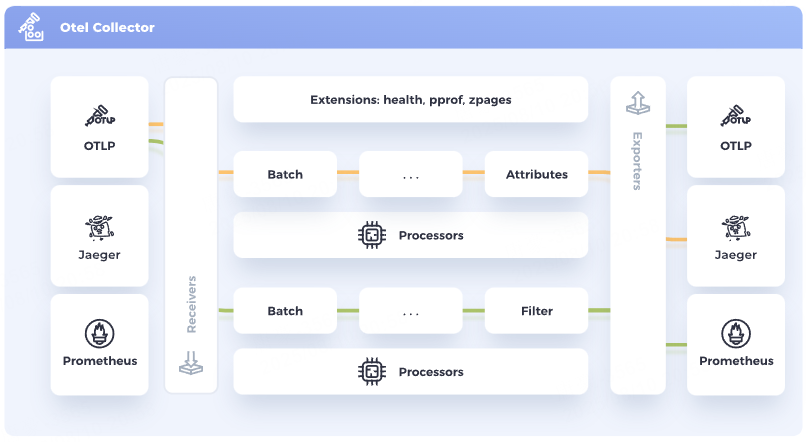
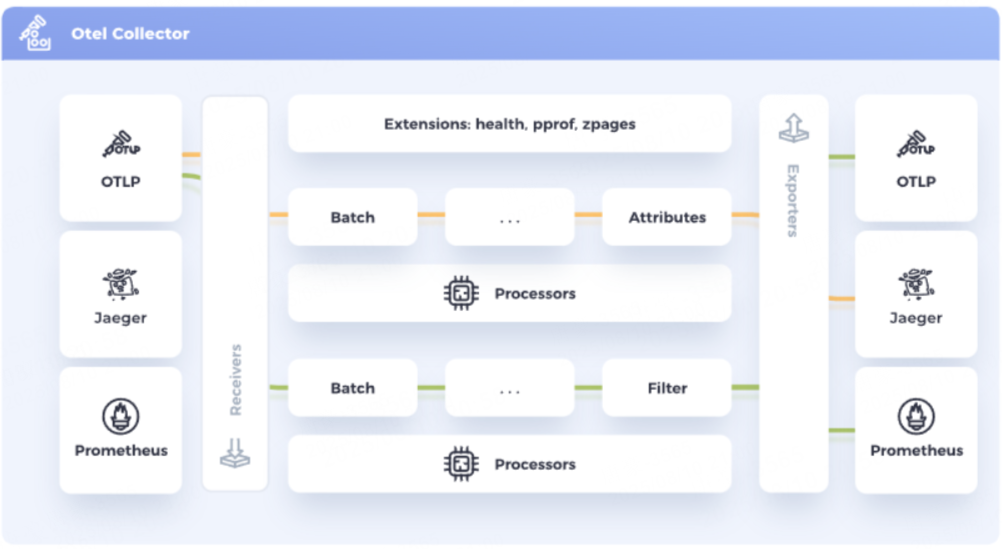
必须和追踪的 服务pod 部署在同一个名称空间
otel收集器: 支持grpc (端口 4317) 和 http (端口 4318)
# cat opentelemetry-collector.yaml
apiVersion: opentelemetry.io/v1beta1
kind: OpenTelemetryCollector
metadata:
  name: otel
  namespace: opentelemetry-operator-system
spec:
  config:
    receivers:
      otlp:
        protocols:
          grpc: {}
          http: {}

    processors:
      memory_limiter:
        check_interval: 1s
        limit_percentage: 75
        spike_limit_percentage: 15
      batch:
        send_batch_size: 10000
        timeout: 10s

    exporters:
      debug: {}
      otlp:
        endpoint: "http://tempo.monitoring:4317"  # 部署的 tempo 地址
        tls:
          insecure: true

    service:
      pipelines:
        traces:
          receivers: [otlp]
          processors: [memory_limiter, batch]
          exporters: [debug, otlp]
        metrics:
          receivers: [otlp]
          processors: [memory_limiter, batch]
          exporters: [debug]
        logs:
          receivers: [otlp]
          processors: [memory_limiter, batch]
          exporters: [debug]

# kubectl apply -f opentelemetry-collector.yaml
# kubectl get po -n opentelemetry-operator-system
NAME                                                        READY   STATUS    RESTARTS   AGE
opentelemetry-operator-controller-manager-c664f5df9-2d9l4   2/2     Running   0          25m
otel-collector-6bcf9fd89-xq7hm                              1/1     Running   0          53s
安装 Instrumentation
OpenTelemetry Operator 可以注入和配置 OpenTelemetry 自动检测库。目前支持Apache HTTPD、DotNet、Go、Java、NodeJS和Python。
若要使用自动检测,请使用 SDK 和检测的配置来配置检测资源。
# cat opentelemetry-instrumentation.yaml
apiVersion: opentelemetry.io/v1alpha1
kind: Instrumentation
metadata:
  name: my-instrumentation
  namespace: opentelemetry-operator-system
spec:
  exporter:
    endpoint: http://otel-collector.opentelemetry-operator-system:4317

  propagators:
    - tracecontext
    - baggage
    - b3

  sampler:
    type: parentbased_traceidratio
    argument: "1"

  env:
    # Java 自动注入配置
    - name: OTEL_JAVAAGENT_ENABLED
      value: "true"
    - name: OTEL_INSTRUMENTATION_JAVA_ENABLED
      value: "true"
    - name: OTEL_EXPORTER_OTLP_ENDPOINT
      value: http://otel-collector.opentelemetry-operator-system:4317
    - name: OTEL_EXPORTER_OTLP_PROTOCOL
      value: grpc   # 如果需要 http/protobuf,则改成 http/protobuf

    # NodeJS 自动注入配置
    - name: OTEL_NODE_RESOURCE_DETECTORS
      value: all
    - name: NODE_OPTIONS
      value: --require @opentelemetry/auto-instrumentations-node/register

    # Python 自动注入配置
    - name: OTEL_PYTHON_ENABLED
      value: "true"
    - name: OTEL_PYTHON_DISTRO
      value: opentelemetry-distro
    - name: OTEL_PYTHON_CONFIGURATOR
      value: opentelemetry-distro-configurator
    - name: OTEL_TRACES_EXPORTER
      value: otlp
    - name: OTEL_METRICS_EXPORTER
      value: otlp
    - name: OTEL_LOGS_EXPORTER
      value: otlp
    - name: OTEL_EXPORTER_OTLP_PROTOCOL
      value: grpc   # Python 也可以改成 http/protobuf

# kubectl apply -f opentelemetry-instrumentation.yaml
# kubectl get instrumentations.opentelemetry.io -n opentelemetry-operator-system
NAME                 AGE   ENDPOINT                                                   SAMPLER                    SAMPLER ARG
my-instrumentation   81s   http://otel-collector.opentelemetry-operator-system:4317   parentbased_traceidratio   1
opentelemetry使用案例
JAVA跟踪案例
部署JAVA服务
# cat opentelemetry-deployment-java.yaml
kind: Deployment
apiVersion: apps/v1
metadata:
  name: spring-boot-helloworld
  namespace: opentelemetry-operator-system
  labels:
    app: spring-boot-helloworld
spec:
  replicas: 1
  selector:
    matchLabels:
      app: spring-boot-helloworld
  template:
    metadata:
      name: spring-boot-helloworld
      labels:
        app: spring-boot-helloworld
      annotations:  # 这个注解非常重要
        instrumentation.opentelemetry.io/inject-java: "true"
    spec:
      containers:
      - name: spring-boot-helloworld
        image: registry.cn-zhangjiakou.aliyuncs.com/tanghao-public/spring-boot-helloworld:v0.9.5
        ports:
        - name: http
          containerPort: 80
          protocol: TCP
---
kind: Service
apiVersion: v1
metadata:
  name: spring-boot-helloworld
  namespace: opentelemetry-operator-system
  labels:
    app: spring-boot-helloworld
spec:
  ports:
    - name: http
      protocol: TCP
      port: 80
      targetPort: 80
  selector:
    app: spring-boot-helloworld

# kubectl apply -f opentelemetry-deployment-java.yaml
### 进入集群中带 curl 的 pod 发起请求
# kubectl exec -it demoapp-7b944679dd-q9m75 -- sh
# curl spring-boot-helloworld.opentelemetry-operator-system
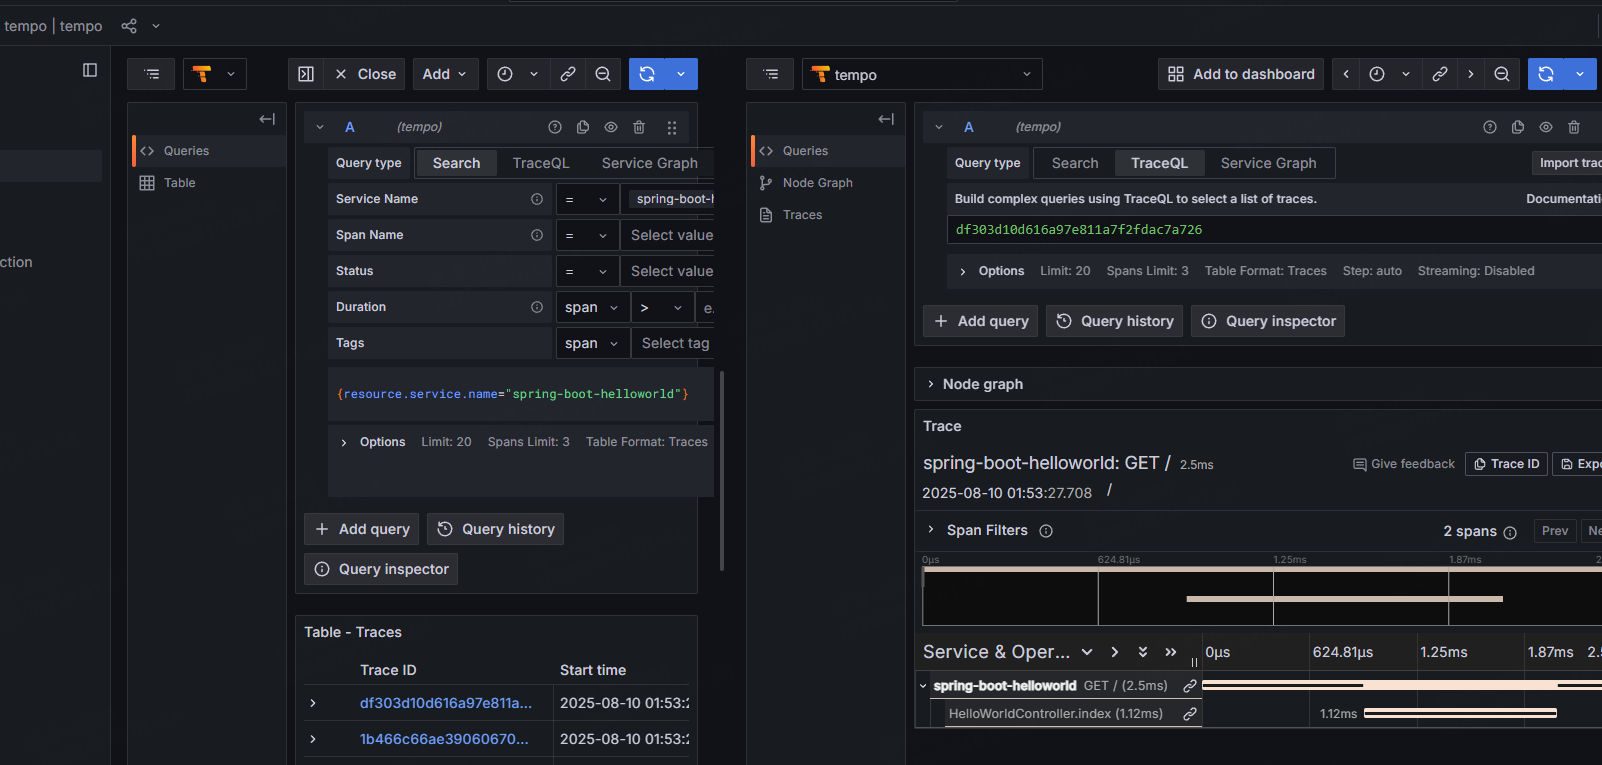
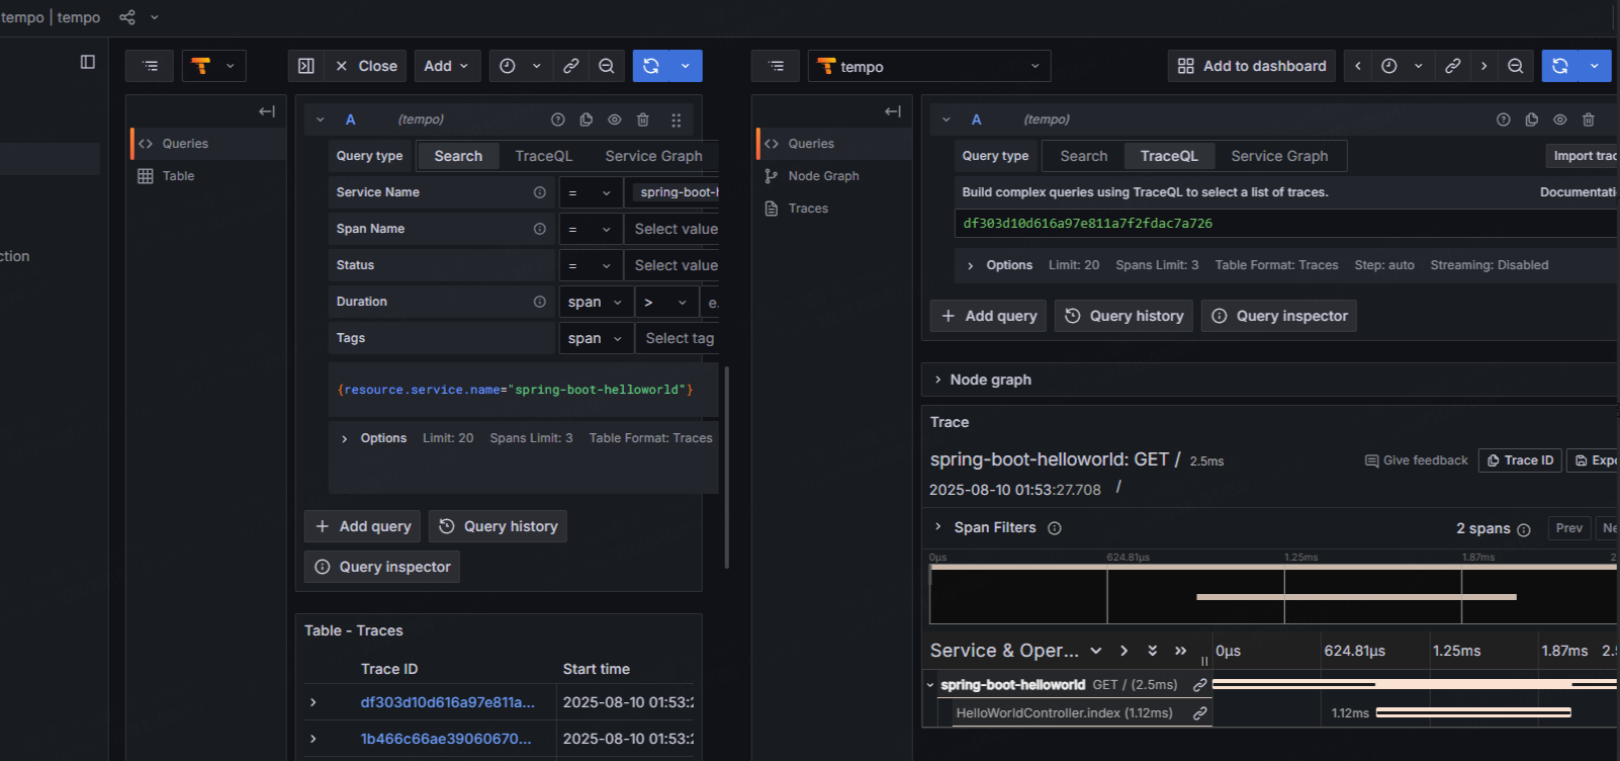
Hello Spring Boot 2.0!grafana tempo里面查询链路追踪情况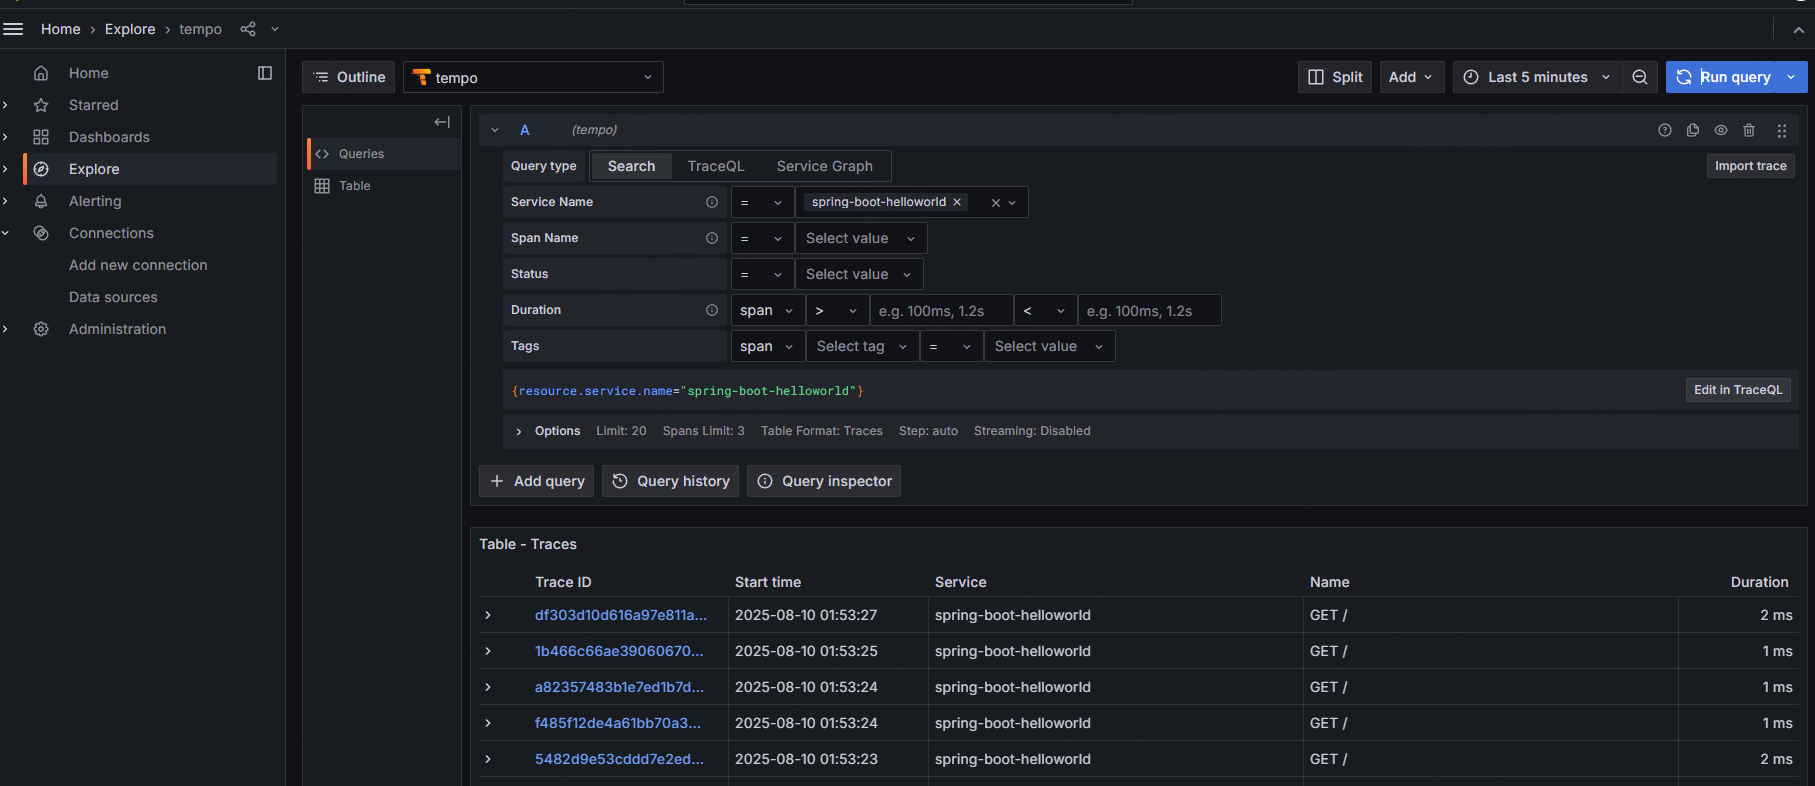

文章评论