架构
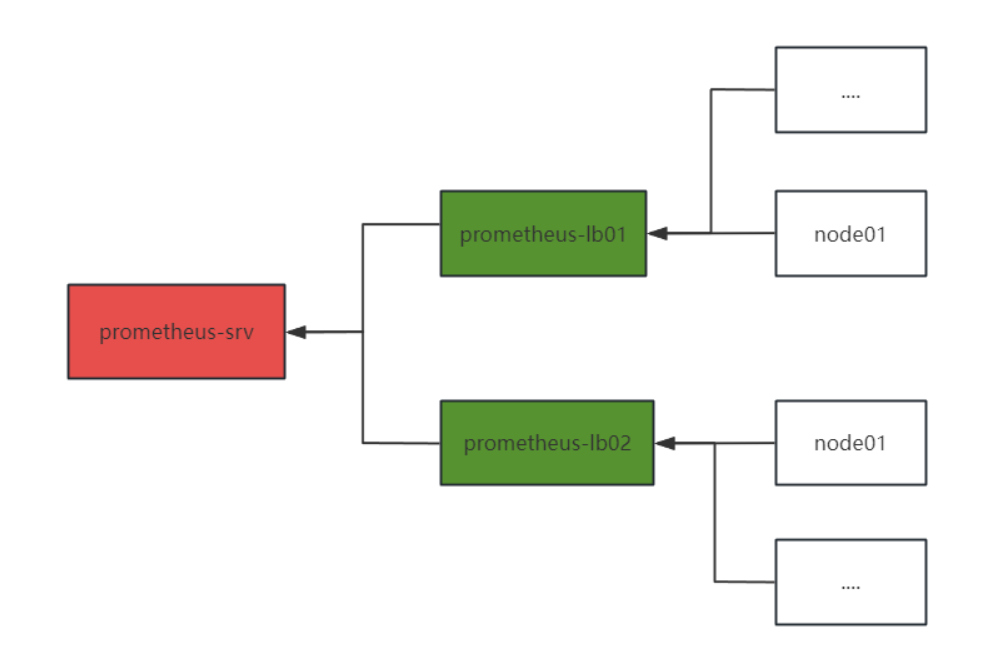
| 主机名 | IP | 角色 |
|---|---|---|
| prometheus-srv | 192.168.139.34 | prometheus服务端 |
| prometheus-lb01 | 192.168.139.35 | prometheus联邦机 |
| prometheus-lb02 | 192.168.139.37 | prometheus联邦机 |
| node01 | 192.168.139.38 | 被监控节点 |
| node02 | 192.168.139.100 | 被监控节点 |
prometheus服务端-部署prometheus
[root@prometheus-srv ~]# mkdir /apps && cd /apps/
[root@prometheus-srv apps]# wget https://github.com/prometheus/prometheus/releases/download/v2.28.1/prometheus-2.37.9.linux-amd64.tar.gz
[root@prometheus-srv apps]# tar xf prometheus-2.37.9.linux-amd64.tar.gz
[root@prometheus-srv apps]# ln -sv prometheus-2.37.9.linux-amd64 prometheus
配置prometheus 的service文件
[root@prometheus-srv apps]# vim /etc/systemd/system/prometheus.service
[Unit]
Description=Prometheus Server
Documentation=https://prometheus.io/docs/introduction/overview/
After=network.target
[Service]
Restart=on-failure
WorkingDirectory=/apps/prometheus/
ExecStart=/apps/prometheus/prometheus --config.file=/apps/prometheus/prometheus.yml
[Install]
WantedBy=multi-user.target
[root@prometheus-srv apps]# systemctl enable --now prometheus.service
prometheus联邦机-部署
我演示一个机器
[root@prometheus-lb01 ~]# mkdir /apps && cd /apps/
[root@prometheus-lb01 apps]# wget https://github.com/prometheus/prometheus/releases/download/v2.28.1/prometheus-2.37.9.linux-amd64.tar.gz
[root@prometheus-lb01 apps]# tar xf prometheus-2.37.9.linux-amd64.tar.gz
[root@prometheus-lb01 apps]# ln -sv prometheus-2.37.9.linux-amd64 prometheus
配置prometheus 的service文件
[root@prometheus-lb01 apps]# vim /etc/systemd/system/prometheus.service
[Unit]
Description=Prometheus Server
Documentation=https://prometheus.io/docs/introduction/overview/
After=network.target
[Service]
Restart=on-failure
WorkingDirectory=/apps/prometheus/
ExecStart=/apps/prometheus/prometheus --config.file=/apps/prometheus/prometheus.yml
[Install]
WantedBy=multi-user.target
[root@prometheus-lb01 apps]# systemctl enable --now prometheus.service
被监控节点-部署
我演示一个机器
[root@node01 apps]# ls
node_exporter-1.6.1.linux-amd64.tar.gz
[root@node01 apps]# tar xf node_exporter-1.6.1.linux-amd64.tar.gz
[root@node01 apps]# ln -sv node_exporter-1.6.1.linux-amd64 node_exporter
配置node_exporter 的service文件
[root@node01 apps]# vim /etc/systemd/system/node-exporter.service
[Unit]
Description=Prometheus Node Exporter
After=network.target
[Service]
ExecStart=/apps/node_exporter/node_exporter
[Install]
WantedBy=multi-user.target
[root@node01 apps]# systemctl enable --now node-exporter.service
配置联邦机监控node_exporter
[root@prometheus-lb01 apps]# vim /apps/prometheus/prometheus.yml
global:
scrape_interval: 15s
evaluation_interval: 15s
alerting:
alertmanagers:
- static_configs:
- targets:
rule_files:
scrape_configs:
- job_name: "prometheus-node"
static_configs:
- targets: ["localhost:9090","192.168.139.38:9100"]
[root@prometheus-lb01 apps]# systemctl restart prometheus.service
[root@prometheus-lb02 apps]# vim /apps/prometheus/prometheus.yml
global:
scrape_interval: 15s
evaluation_interval: 15s
alerting:
alertmanagers:
- static_configs:
- targets:
rule_files:
scrape_configs:
- job_name: "prometheus-node"
static_configs:
- targets: ["localhost:9090","192.168.139.100:9100"]
[root@prometheus-lb02 apps]# systemctl restart prometheus.service
配置prometheus服务端监控联邦机
[root@prometheus-srv apps]# vim /apps/prometheus/prometheus.yml
global:
scrape_interval: 15s
evaluation_interval: 15s
alerting:
alertmanagers:
- static_configs:
- targets:
# - alertmanager:9093
rule_files:
scrape_configs:
- job_name: "prometheus"
static_configs:
- targets: ["localhost:9090"]
- job_name: 'prometheus-federate'
scrape_interval: 10s
honor_labels: true
metrics_path: '/federate'
params:
'match[]':
- '{job="prometheus"}'
- '{__name__=~"job:.*"}'
- '{__name__=~"node.*"}'
static_configs:
- targets:
- '192.168.139.35:9090'
- '192.168.139.37:9090'
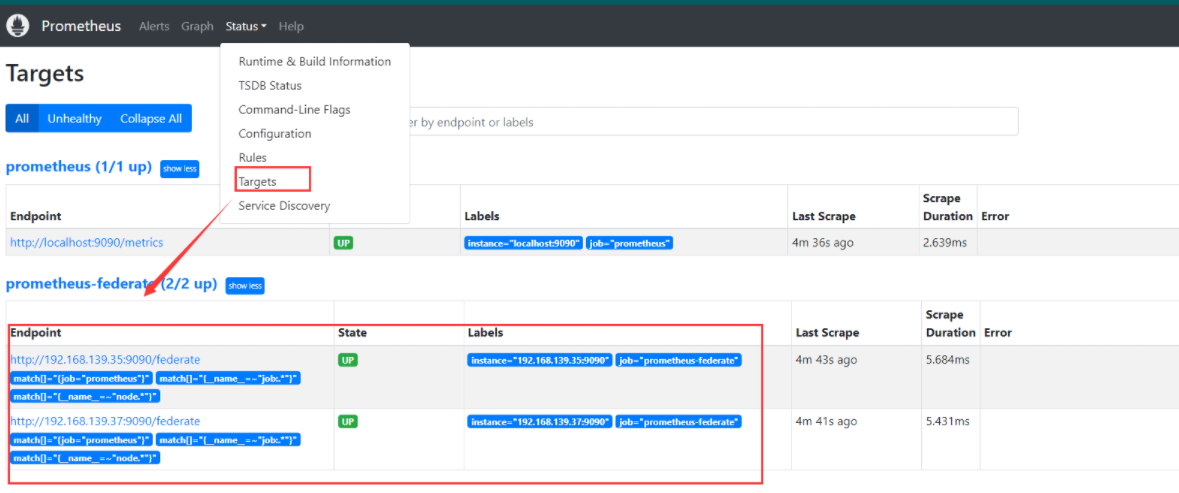
验证
部署grafana
 [root@prometheus-srv apps]# wget https://dl.grafana.com/oss/release/grafana-10.1.5.linux-amd64.tar.gz
 [root@prometheus-srv apps]# tar xf grafana-10.1.5.linux-amd64.tar.gz
 [root@prometheus-srv apps]# ln -sv /apps/grafana-10.1.5 /apps/grafana
 [root@prometheus-srv apps]# vim /etc/systemd/system/grafana.service
 [Unit]
 Description=grafana

 [Service]
 ExecStart=/apps/grafana/bin/grafana-server -homepath=/apps/grafana
 ExecReload=/bin/kill -HUP $MAINPID
 KillMode=process
 Restart=on-failure

 [Install]
 WantedBy=multi-user.target
 修改grafana的web为中文
 oot@prometheus-srv apps]# grep -n 'default_language' grafana/conf/defaults.ini
 471:default_language = zh-Hans
 [root@prometheus-srv apps]# systemctl enable --now grafana.service
-
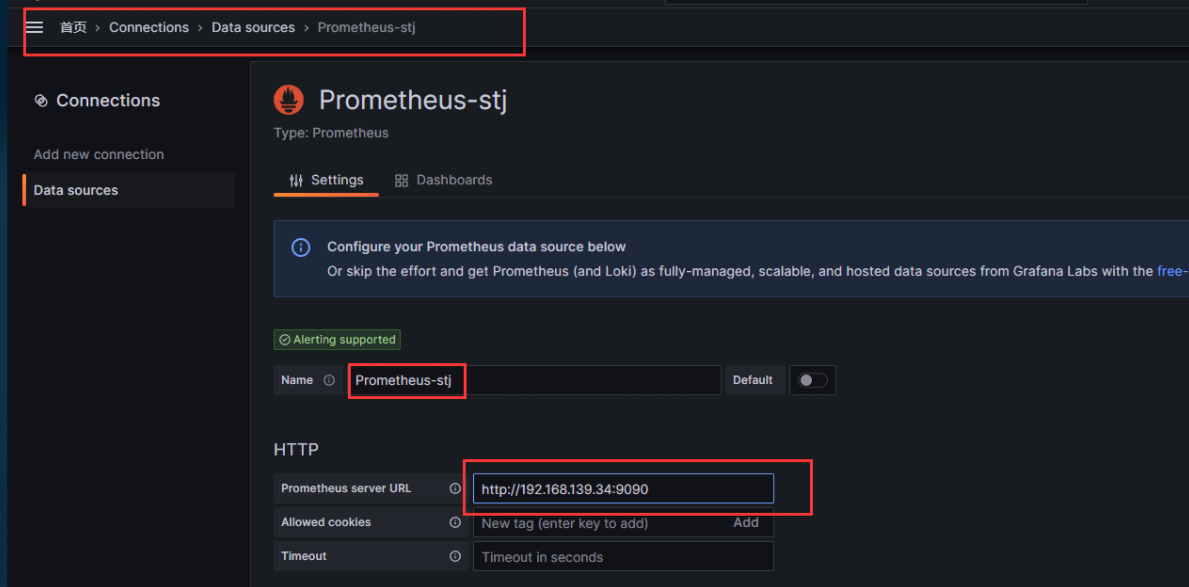
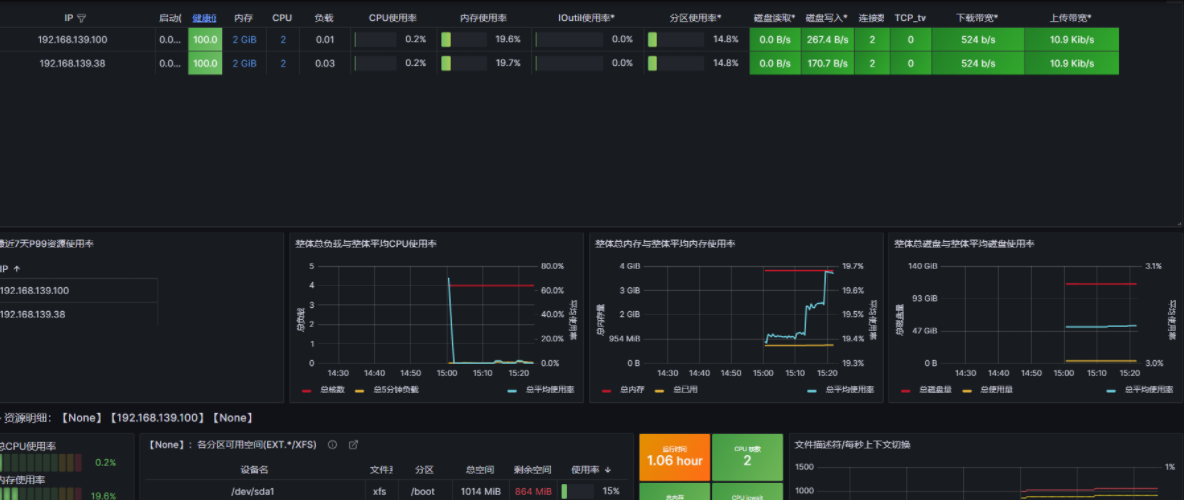
访问GUI



文章评论