lstio中使用Flagger实现金丝雀发布
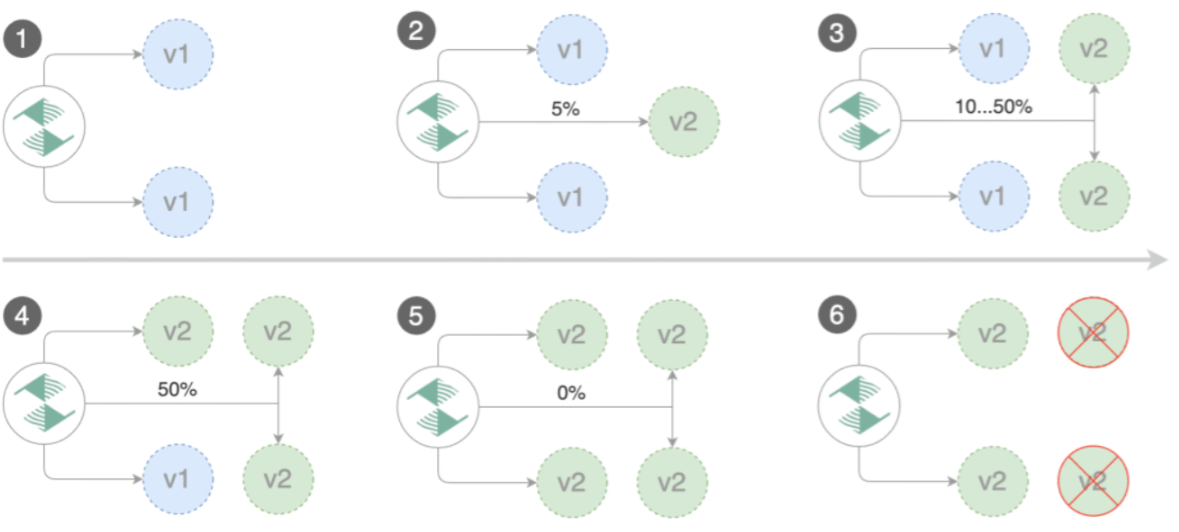
在 lstio中要实现灰度发布有多种方案,比如Flagger .Argo Rollouts等。
Flagger
Flagger是一个渐进式交付的 Kubernetes Operator,它可以自动执行Kubernetes上运行的应用程序的发布过程。它通过在测量指标和运行一致性测试的同时逐渐将流量转移到新版本,降低了在生产中引入新软件版本的风险。
Flagger通过使用服务网格(App Mesh、Istio、Linkerd、Kuma、Open Service Mesh)或Ingress控制器(Contour、Gloo、NGINX、Skipper、Traefik、APISIX)用于流量路由。对于发布分析,Flagger可以查询Prometheus、InfluxDBDatadog、New Relic、CloudWatch、Stackdriver或 Graphite,并使用Slack、MS Teams、Discord和 Rocket来发出警报。
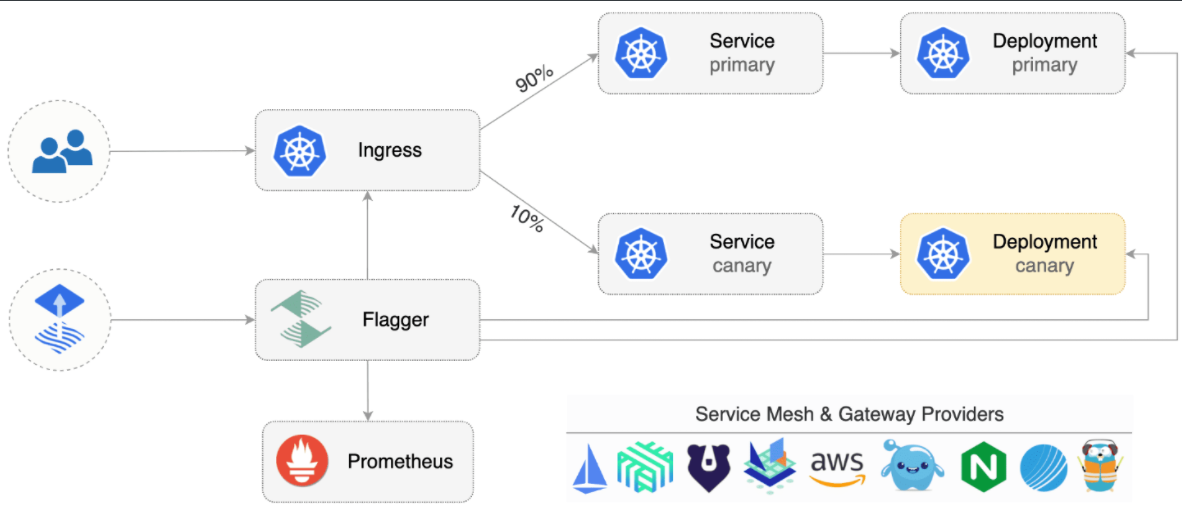
Flagger可以使用Kubernetes CRD进行配置,并且与任何为Kubernetes 制作的CI/CD解决方案兼容。由于Flagger是声明性的对Kubernetes事件做出反应,因此它可以与诸如此类的工具一起在Git0ps管道中使用。
安装Flagger
要使用Flagger ,需要先选择一个受支持的路由提供商(比如我们这里使用lstio),然后使用Helm 或 Kustomize安装 Flagger。
Flagger需要Kubernetes集群v1.16或更高版本以及lstio v1.5或更高版本。
首先当然需要安装lstio,并开启Prometheus插件:
 #demo 或者default都可以
 root@k8s-master01:~# istioctl manifest install --set profile=demo -y
 root@k8s-master01:~/istio# kubectl apply -f istio-1.22.2/samples/addons/prometheus.yaml
部署flagger到k8s
 root@k8s-master01:~# git clone https://github.com/fluxcd/flagger.git
 root@k8s-master01:~# cd flagger/
 root@k8s-master01:~/flagger# kubectl apply -k kustomize/istio/
 root@k8s-master01:~/flagger# kubectl get pod -n istio-system
 NAME                                   READY   STATUS    RESTARTS       AGE
 flagger-78f6f77854-wmnm5               1/1     Running   0              76s
 ....
 root@k8s-master01:~/flagger# kubectl get crd | grep fla
 alertproviders.flagger.app                 2024-08-14T13:52:15Z
 canaries.flagger.app                       2024-08-14T13:52:15Z
 metrictemplates.flagger.app                2024-08-14T13:52:15Z
测试应用
下面我们创建一个名为 test的命名空间,并为其启用Istio sidecar自动注入∶
 root@k8s-master01:~/flagger# kubectl create ns test
 root@k8s-master01:~/flagger# kubectl label ns test  istio-injection=enabled
接下来我们使用flagger官方提供的podinfo应用来进行测试:
 root@k8s-master01:~/flagger# kubectl apply -k kustomize/podinfo/
 root@k8s-master01:~/flagger# kubectl get deploy -n test
 NAME      READY   UP-TO-DATE   AVAILABLE   AGE
 podinfo   2/2     2            1           58s
 root@k8s-master01:~/flagger# kubectl get hpa -n test
 NAME      REFERENCE            TARGETS         MINPODS   MAXPODS   REPLICAS   AGE
 podinfo   Deployment/podinfo   <unknown>/99%   2         4         2          72s
 root@k8s-master01:~/flagger# kubectl get po -n test
 NAME                       READY   STATUS    RESTARTS   AGE
 podinfo-6cf8bdbd9f-c2rzw   2/2     Running   0          96s
 podinfo-6cf8bdbd9f-c46fm   2/2     Running   0          81s
接着我们再部署一个负载测试服务用于在金丝雀分析期间生成流量︰(主要用来验证金丝雀效果)
 root@k8s-master01:~/flagger# kubectl apply -k kustomize/tester/
 root@k8s-master01:~/flagger# kubectl get po -n test
 NAME                                 READY   STATUS    RESTARTS   AGE
 flagger-loadtester-96b57bb8c-nckbt   2/2     Running   0          37s
 podinfo-6cf8bdbd9f-c2rzw             2/2     Running   0          5m43s
 podinfo-6cf8bdbd9f-c46fm             2/2     Running   0          5m28s
创建金丝雀
接下来我们就胡以创建一个Canary自定义资源来实现我们的金丝雀发布了。Canary对象是Flagger 的核心,它描述了金丝雀发布的目标。如下所示,我们为podinfo应用创建一个Canary对象:
root@k8s-master01:~/flagger# cat podinfo-canary.yaml
apiVersionflagger.app/v1beta1
kindCanary
metadata
namepodinfo
namespacetest
spec
targetRef# deployment 引用
apiVersionapps/v1
kindDeployment
namepodinfo
progressDeadlineSeconds60 # 金丝雀部署升级最大处理时间(以秒为单位)(默认600秒)
autoscalerRef# HPA 引用(可选)
apiVersionautoscaling/v2
kindHorizontalPodAutoscaler
namepodinfo
service
port9898
targetPort9898
gateways# Istio 网关(可选)
istio-system/public-gateway
hosts# VirtualService 主机名 (optional)
podinfo.k8s.local
trafficPolicy# Istio 流量策略(可选)
tls
# use ISTIO_MUTUAL when mTLS is enabled
modeDISABLE
retries# Istio 重试策略(可选)
attempts3
perTryTimeout1s
retryOn"gateway-error,connect-failure,refused-stream"
analysis# 金丝雀分析
interval1m # 金丝雀分析间隔时间(默认 60s)
threshold5 # 金丝雀分析失败阈值(默认 5)
maxWeight50 # 金丝雀最大流量权重(默认 50)
stepWeight10 # 金丝雀流量权重步长(默认 10)
metrics
namerequest-success-rate
# minimum req success rate (non 5xx responses)
# percentage (0-100)
thresholdRange
min99
interval1m
namerequest-duration
# maximum req duration P99
# milliseconds
thresholdRange
max500
interval30s
# testing (optional)
webhooks
nameacceptance-test
typepre-rollout
urlhttp//flagger-loadtester.test/
timeout30s
metadata
typebash
cmd"curl -sd 'test' http://podinfo-canary:9898/token | grep token"
nameload-test
urlhttp//flagger-loadtester.test/
timeout5s
metadata
# 使用 hey 工具对 podinfo-canary 进行为期1分钟的负载测试,每秒发送10个请求,且测试过程中会维持2个并发连接。
cmd"hey -z 1m -q 10 -c 2 http://podinfo-canary.test:9898/"
上面的配置文件中,我们定义了 podinfo 应用的金丝雀发布策略,其中 targetRef 指定了要进行金丝雀发布的 Deployment 对象,service 指定了金丝雀发布的服务,analysis 指定了金丝雀分析策略,这里我们指定了两个内置的指标检查:request-success-rate 和 request-duration,其中 request-success-rate 指定了 HTTP 请求成功率,request-duration 指定了请求持续时间。对于每个指标,你可以使用 thresholdRange 和窗口大小或时间序列指定可接受的值范围和时间间隔。内置检查适用于每个服务网格/Ingress 控制器,并通过 Prometheus 查询实现。
在 service 中我们指定了 Istio 的 Gateway(istio-system/public-gateway)以及 VirtualService 要使用的主机名,首先我们可以为该应用创建一个 Gateway 对象:
root@k8s-master01:~/flagger# cat public-gateway.yaml
apiVersionnetworking.istio.io/v1alpha3
kindGateway
metadata
namepublic-gateway
namespaceistio-system
spec
selector
istioingressgateway
servers
port
number80
namehttp
protocolHTTP
hosts
"*"
另外我们在上面的对象中通过 webhooks 字段指定了金丝雀分析期间要执行的测试,其中 acceptance-test 用于在金丝雀分析开始之前执行,load-test 用于在金丝雀分析期间执行。
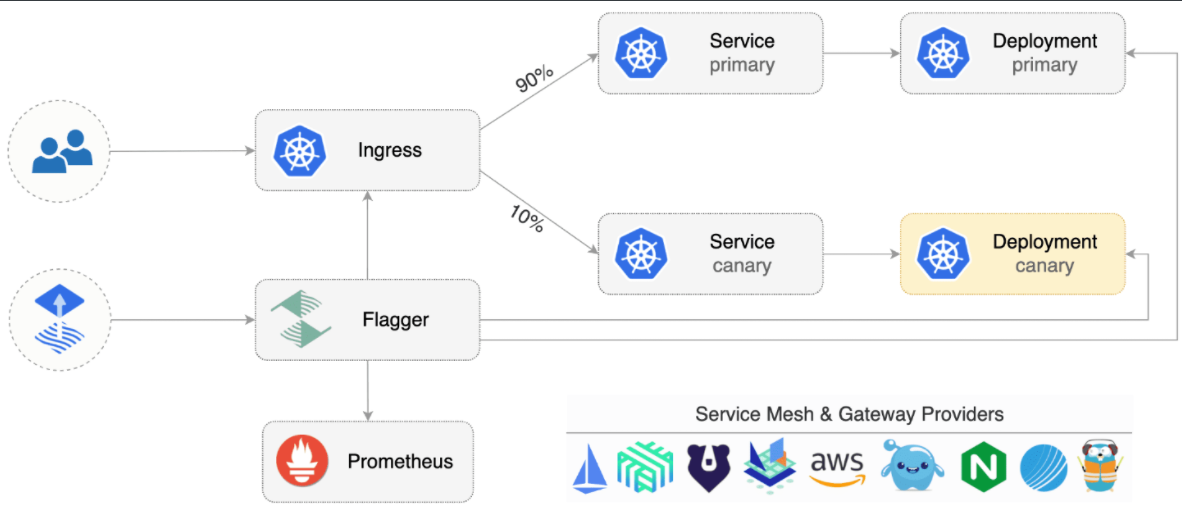
接下来我们可以直接创建 Canary 对象了:
 root@k8s-master01:~/flagger# kubectl apply -f public-gateway.yaml
 root@k8s-master01:~/flagger# kubectl apply -f podinfo-canary.yaml
当创建了 Canary 对象后,Flagger 会自动创建一个名为 pod-info-primary 的 Deployment 以及两个版本的 Service 对象:
 root@k8s-master01:~/flagger# kubectl get svc -n test
 NAME                 TYPE        CLUSTER-IP       EXTERNAL-IP   PORT(S)    AGE
 flagger-loadtester   ClusterIP   173.96.10.128    <none>        80/TCP     16m
 podinfo              ClusterIP   173.96.197.37    <none>        9898/TCP   42s
 podinfo-canary       ClusterIP   173.96.203.207   <none>        9898/TCP   102s
 podinfo-primary      ClusterIP   173.96.147.150   <none>        9898/TCP   102s
可以看到我们原本的 podinfo 应用已经从 podinfo 这个 Deployment 迁移到了 podinfo-primary 这个 Deployment 之上。
此外还有 Istio 相关的对象:
 root@k8s-master01:~/flagger# kubectl get vs -ntest
 NAME      GATEWAYS                          HOSTS                             AGE
 podinfo   ["istio-system/public-gateway"]   ["podinfo.k8s.local","podinfo"]   5m34s
 root@k8s-master01:~/flagger# kubectl get dr -ntest
 NAME              HOST              AGE
 podinfo-canary    podinfo-canary    5m48s
 podinfo-primary   podinfo-primary   5m48s
我们可以查看下自动生成的 VirtualService 对象:
 root@k8s-master01:~/flagger#  kubectl get vs -ntest podinfo -oyaml
 apiVersion: networking.istio.io/v1
 kind: VirtualService
 metadata:
   annotations:
     helm.toolkit.fluxcd.io/driftDetection: disabled
     kustomize.toolkit.fluxcd.io/reconcile: disabled
   creationTimestamp: "2024-08-14T14:19:42Z"
   generation: 1
   name: podinfo
   namespace: test
   ownerReferences:
   - apiVersion: flagger.app/v1beta1
     blockOwnerDeletion: true
     controller: true
     kind: Canary
     name: podinfo
     uid: 3561d268-5ea9-452d-be8d-622469c18a6d
   resourceVersion: "1337334"
   uid: a29b933b-d21f-4730-a20e-a595c93a49b8
 spec:
   gateways:
   - istio-system/public-gateway
   hosts:
   - podinfo.k8s.local
   - podinfo
   http:
   - retries:
       attempts: 3
       perTryTimeout: 1s
       retryOn: gateway-error,connect-failure,refused-stream
     route:
     - destination:
         host: podinfo-primary
       weight: 100
     - destination:
         host: podinfo-canary
       weight: 0
从上面的配置中我们可以看到当前 podinfo 应用的流量全部被路由到了 podinfo-primary 对象上,而 podinfo-canary 对象的流量权重为 0,当然同样可以查看 DestinationRule 对象:
 root@k8s-master01:~/flagger# kubectl get dr podinfo-primary -ntest -oyaml
 apiVersion: networking.istio.io/v1
 kind: DestinationRule
 metadata:
   creationTimestamp: "2024-08-14T14:19:42Z"
   generation: 1
   name: podinfo-primary
   namespace: test
   ownerReferences:
   - apiVersion: flagger.app/v1beta1
     blockOwnerDeletion: true
     controller: true
     kind: Canary
     name: podinfo
     uid: 3561d268-5ea9-452d-be8d-622469c18a6d
   resourceVersion: "1337320"
   uid: 68eba0f3-504d-4943-b441-1b35254e2749
 spec:
   host: podinfo-primary
   trafficPolicy:
     tls:
       mode: DISABLE
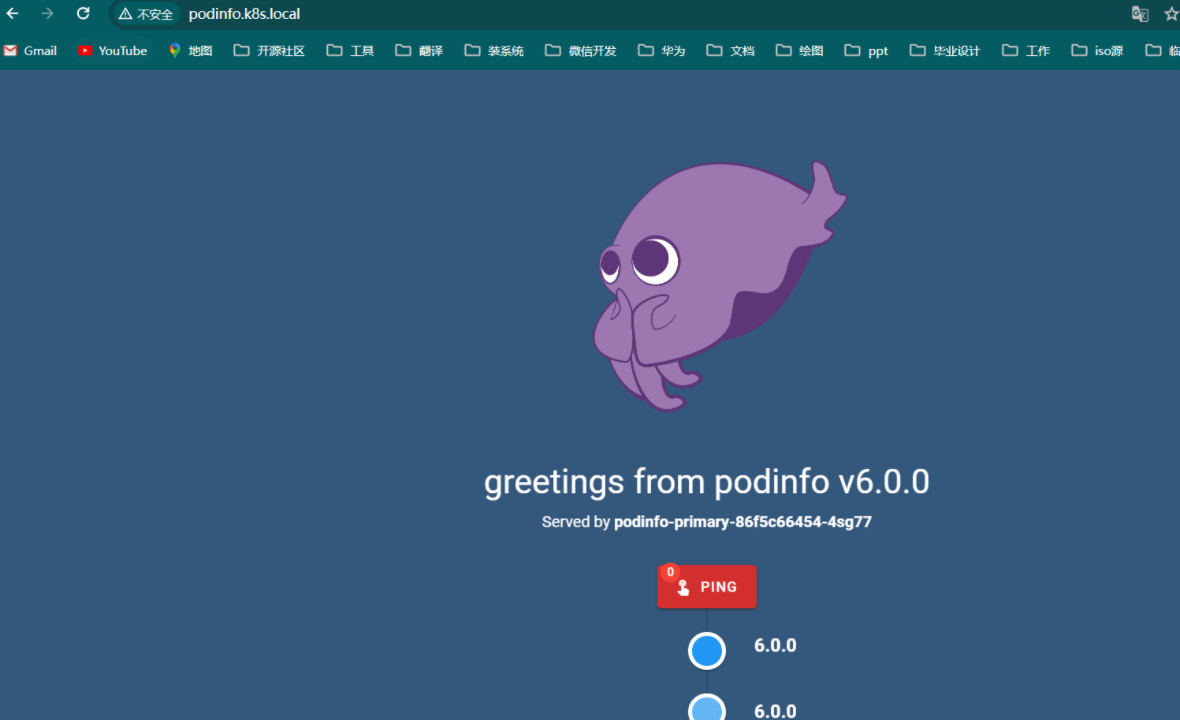
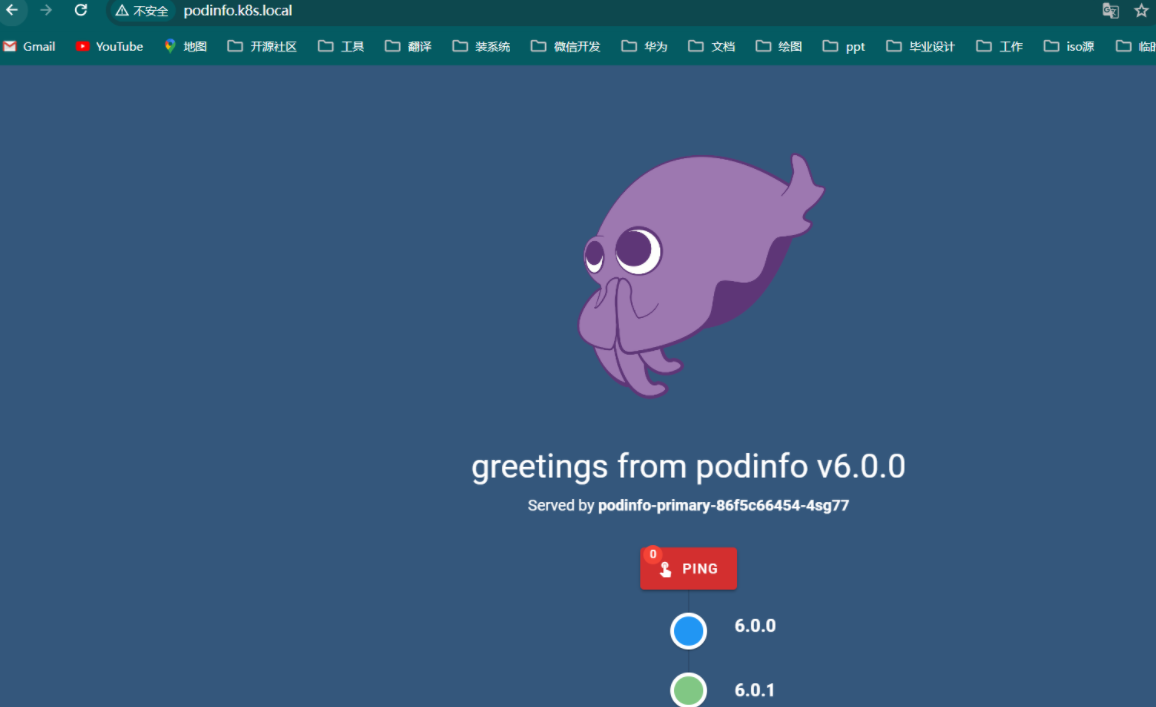
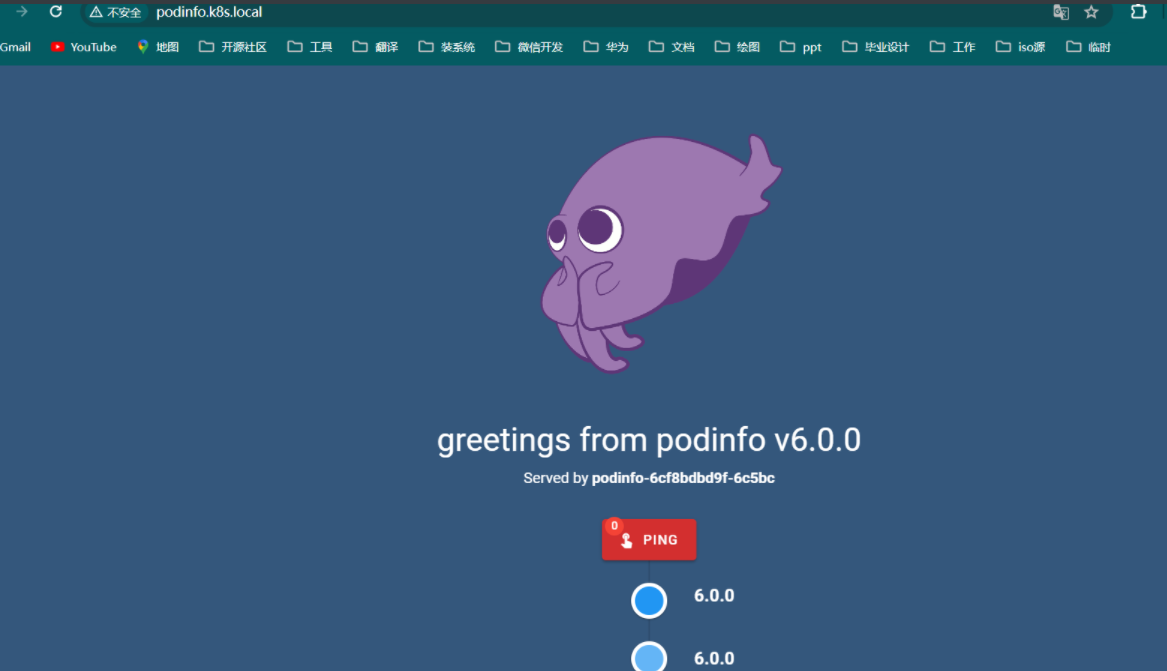
所以默认情况下现在我们访问到的就是 podinfo-primary 这个 Deployment 对象,也就是目前的默认版本。我们可以在浏览器中访问 podinfo 来查看当前的版本:
自动金丝雀发布
我们可以看到现在的版本是 podinfo v6.0.0,接下来我们来升级应用触发金丝雀发布。要触发金丝雀发布,可以由以下任何对象的更改来触发:
-
Deployment PodSpec(、命令、端口、环境变量、资源等)
-
作为卷挂载或映射到环境变量的 ConfigMaps
-
作为卷挂载或映射到环境变量的 Secrets
比如我们可以直接修改 Deployment 对象的镜像版本来触发自动化的金丝雀发布:
root@k8s-master01:~/flagger# kubectl -n test set image deployment/podinfo podinfod=ghcr.io/stefanprodan/podinfo:6.0.1
 root@k8s-master01:~/flagger# kubectl describe canaries podinfo -ntest
   Normal   Synced  2m12s              flagger  Advance podinfo.test canary weight 20
   Normal   Synced  72s                flagger  Advance podinfo.test canary weight 30
   Normal   Synced  12s                flagger  Advance podinfo.test canary weight 40
需要注意在金丝雀分析期间对 Deployment 应用新的更改,Flagger 将重新启动分析。第一步是先会去扩容 podinfo 应用:
 root@k8s-master01:~/flagger# kubectl get pods -ntest
 NAME                                 READY   STATUS    RESTARTS   AGE
 flagger-loadtester-96b57bb8c-nckbt   2/2     Running   0          32m
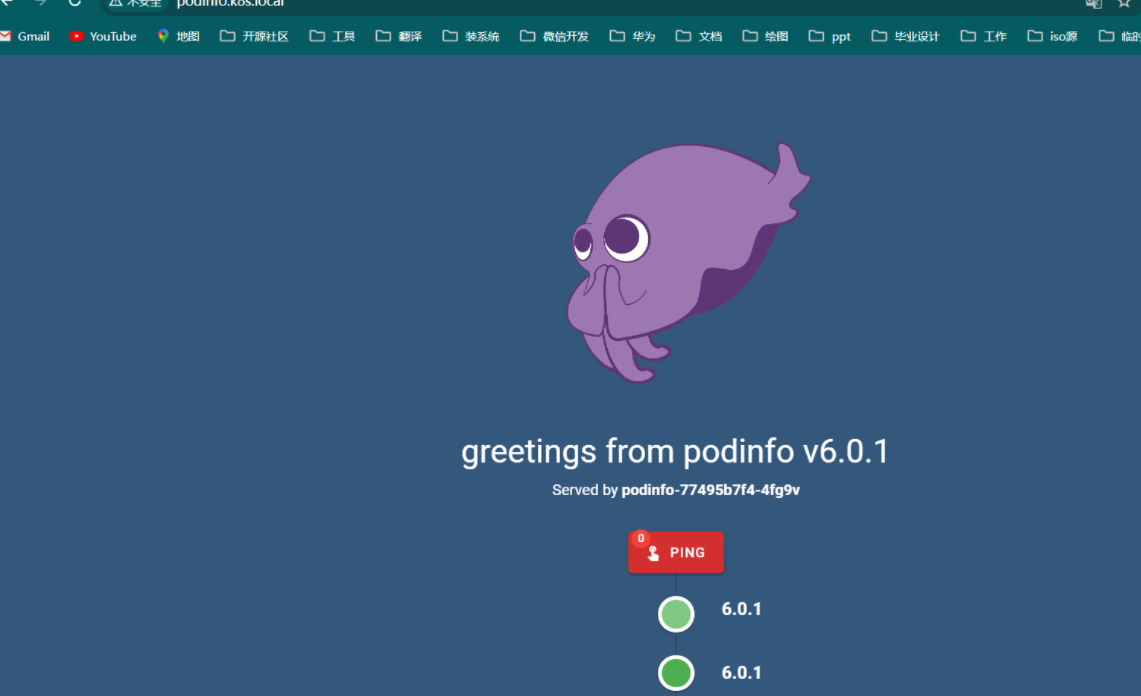
 podinfo-77495b7f4-4fg9v              2/2     Running   0          5m55s
 podinfo-77495b7f4-whqfr              2/2     Running   0          5m55s
 podinfo-primary-86f5c66454-4sg77     2/2     Running   0          16m
 podinfo-primary-86f5c66454-72x7k     2/2     Running   0          16m
然后就会根据我们在 Canary 对象中定义的金丝雀分析策略来进行分析,并一步步将金丝雀版本的权重提高。
自动回滚
在金丝雀分析期间,我们可以生成 HTTP 500 错误和高延迟来测试 Flagger 是否暂停发布。
比如我们触发另一个金丝雀发布:
root@k8s-master01:~/flagger# kubectl -n test set image deployment/podinfo podinfod=ghcr.io/stefanprodan/podinfo:6.0.2
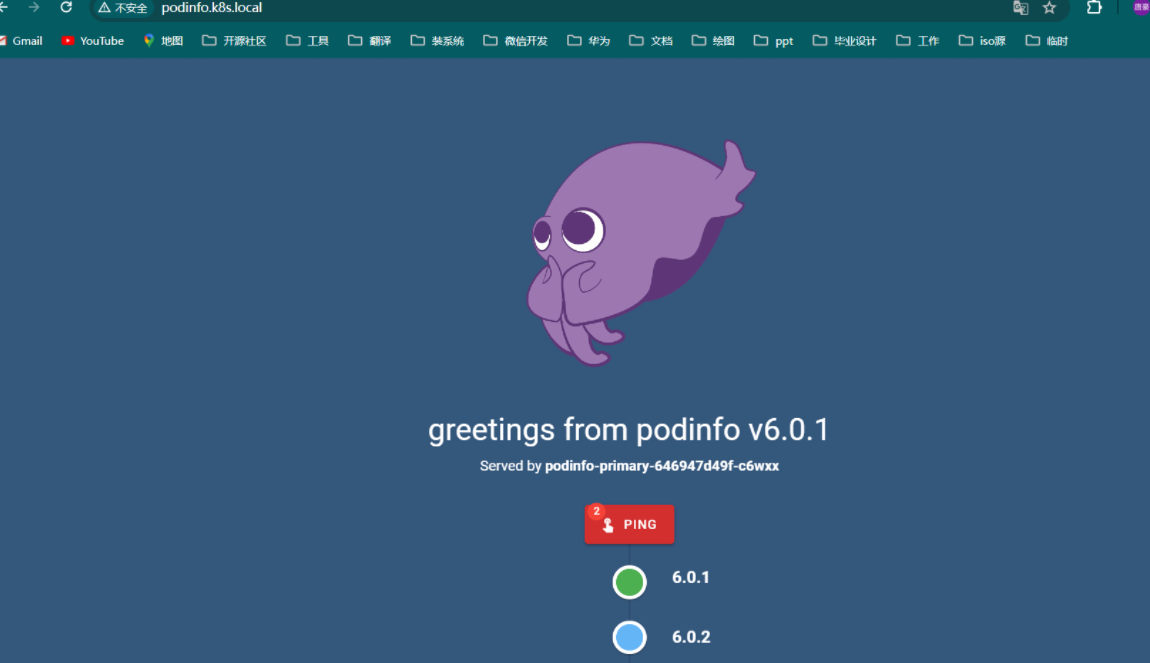
 root@k8s-master01:~/flagger# kubectl describe canaries podinfo -ntest
 Warning  Synced  3m2s (x2 over 13m)  flagger  Halt advancement no values found for istio metric request-success-rate probably podinfo.test is not receiving traffic: running query failed: no values found
 Normal   Synced  2m2s (x2 over 12m)  flagger  Advance podinfo.test canary weight 20
 Warning  Synced  62s                 flagger  Halt advancement no values found for istio metric request-duration probably podinfo.test is not receiving traffic
 Normal   Synced  2s (x5 over 9m2s)   flagger  (combined from similar events): Advance podinfo.test canary weight 30
然后进入 loadtester 容器:
kubectl -n test exec -it flagger-loadtester-xx-xx sh
使用下面的命令来生成 HTTP 500 错误:
 watch curl http://podinfo-canary:9898/status/500
 #也可以添加延迟:
 watch curl http://podinfo-canary:9898/delay/1
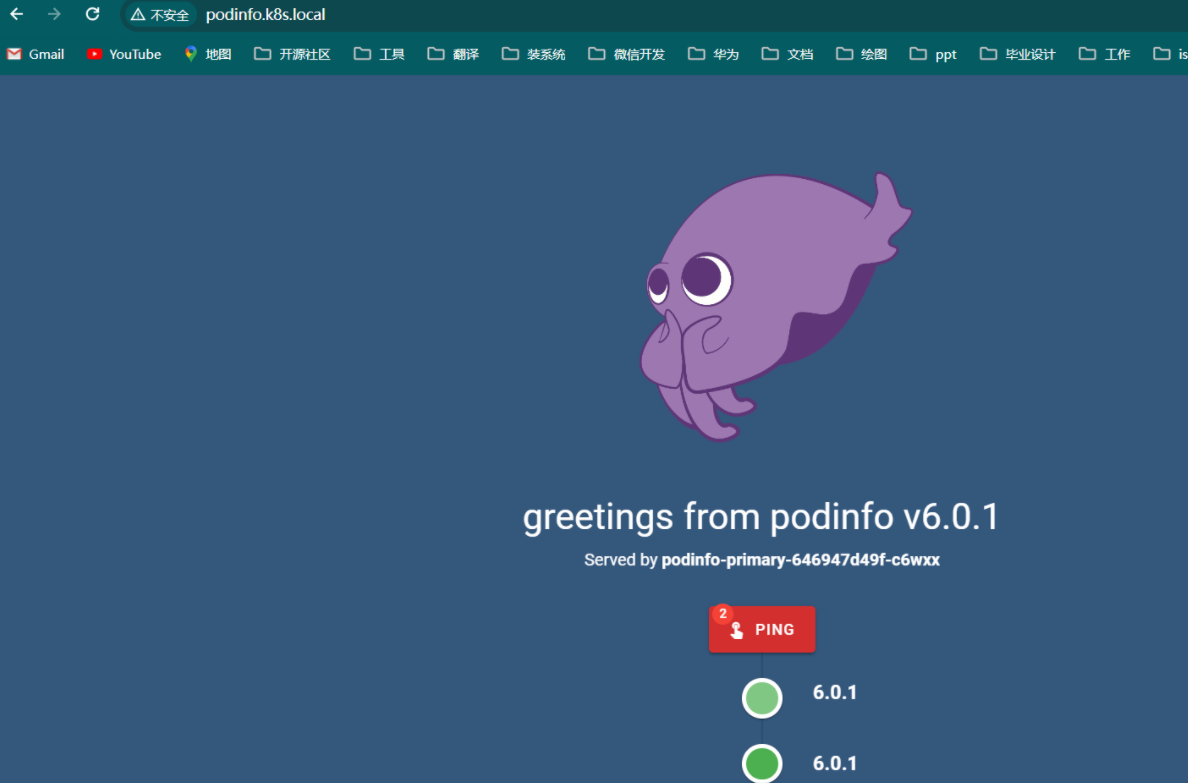
当失败检查的次数达到金丝雀分析配置的阈值时,流量将路由回主节点,金丝雀将缩放为零,并将部署标记为失败。
 root@k8s-master01:~/flagger# kubectl describe canaries podinfo -ntest
   Normal   Synced  7m53s (x6 over 17m)  flagger  (combined from similar events): Advance podinfo.test canary weight 40
   Warning  Synced  6m53s                flagger  Halt podinfo.test advancement success rate 98.02% < 99%
   Warning  Synced  5m53s                flagger  Halt podinfo.test advancement success rate 22.22% < 99%
   Warning  Synced  4m53s                flagger  Halt podinfo.test advancement success rate 97.65% < 99%
   Warning  Synced  3m53s                flagger  Rolling back podinfo.test failed checks threshold reached 5
   Warning  Synced  3m53s                flagger  Canary failed! Scaling down podinfo.test
会话亲和性
虽然 Flagger 可以单独执行加权路由和 A/B 测试,但通过 Istio,它可以将两者结合起来,从而形成具有会话关联性的 Canary 版本。这种部署策略将金丝雀发布与 A/B 测试相结合,当我们尝试逐步向用户推出新功能时,金丝雀发布是很有帮助的,但由于其路由的特性(基于权重),即使用户之前已经被路由到新版本,他们仍然还有路由到应用程序的旧版本上,这种情况可能不符合我们的预期。
由于 A/B 测试对于需要会话关联的应用程序特别有用,因此我们将基于 cookie 的路由与常规的基于权重的路由集成在一起,这意味着一旦用户接触到我们应用程序的新版本(基于流量权重),他们总是会被路由到该版本,不会被路由回我们应用程序的旧版本。
我们可以通过在 Canary 对象中指定 .spec.anasyis.sessionAffinity 来启用此功能:
analysis
# schedule interval (default 60s)
interval1m
# max number of failed metric checks before rollback
threshold10
# max traffic percentage routed to canary
# percentage (0-100)
maxWeight50
# canary increment step
# percentage (0-100)
stepWeight2
# session affinity config
sessionAffinity
# name of the cookie used
cookieNameflagger-cookie
# max age of the cookie (in seconds)
# optional; defaults to 86400
maxAge21600
其中 .spec.analysis.sessionAffinity.cookieName 是存储的 Cookie 的名称,cookie 的值是随机生成的字符串,充当唯一标识符,对于上述配置,在 Canary 运行期间路由到 Canary 版本的请求的响应头将如下所示:
Set-Cookie: flagger-cookie=LpsIaLdoNZ; Max-Age=21600
Canary 运行结束并且所有流量都转移回主应用后,所有响应都将具有以下 Header:
Set-Cookie: flagger-cookie=LpsIaLdoNZ; Max-Age=-1
这告诉客户端删除 cookie,确保用户系统中没有垃圾 cookie。
如果触发新的 Canary 运行,响应标头将被路由到 Canary 版本的所有请求设置一个新的 cookie:
Set-Cookie: flagger-cookie=McxKdLQoIN; Max-Age=21600
比如我们这里的 podinfo 这个金丝雀对象如果想要启用会话亲和性,我们可以这样配置:
 root@k8s-master01:~/istio# vim  podinfo-canary-session-affinity.yaml
 apiVersion: flagger.app/v1beta1
 kind: Canary
 metadata:
   name: podinfo
   namespace: test
 spec:
   targetRef:
     apiVersion: apps/v1
     kind: Deployment
     name: podinfo
   progressDeadlineSeconds: 60
   autoscalerRef:
     apiVersion: autoscaling/v2
     kind: HorizontalPodAutoscaler
     name: podinfo
   service:
     port: 9898
     targetPort: 9898
     gateways:
       - istio-system/public-gateway
     hosts:
       - podinfo.k8s.local
     trafficPolicy:
       tls:
         mode: DISABLE
     retries:
       attempts: 3
       perTryTimeout: 1s
       retryOn: "gateway-error,connect-failure,refused-stream"
   analysis:
     interval: 1m
     threshold: 5
     maxWeight: 50
     stepWeight: 10
     sessionAffinity:             # session 亲和性配置
       cookieName: flagger-cookie # cookie 名称
       maxAge: 21600              # cookie 最大存活时间(秒),默认为 86400
     metrics:
       - name: request-success-rate
         thresholdRange:
           min: 99
         interval: 1m
       - name: request-duration
         thresholdRange:
           max: 500
         interval: 30s
     webhooks:
       - name: acceptance-test
         type: pre-rollout
         url: http://flagger-loadtester.test/
         timeout: 30s
         metadata:
           type: bash
           cmd: "curl -sd 'test' http://podinfo-canary:9898/token | grep token"
       - name: load-test
         url: http://flagger-loadtester.test/
         timeout: 5s
         metadata:
           cmd: "hey -z 1m -q 10 -c 2 http://podinfo-canary.test:9898/"
root@k8s-master01:~/istio# kubectl apply -f podinfo-canary-session-affinity.yaml
更新后我们可以重新触发金丝雀发布:
root@k8s-master01:~/istio# kubectl -n test set image deployment/podinfo podinfod=ghcr.io/stefanprodan/podinfo:6.0.0
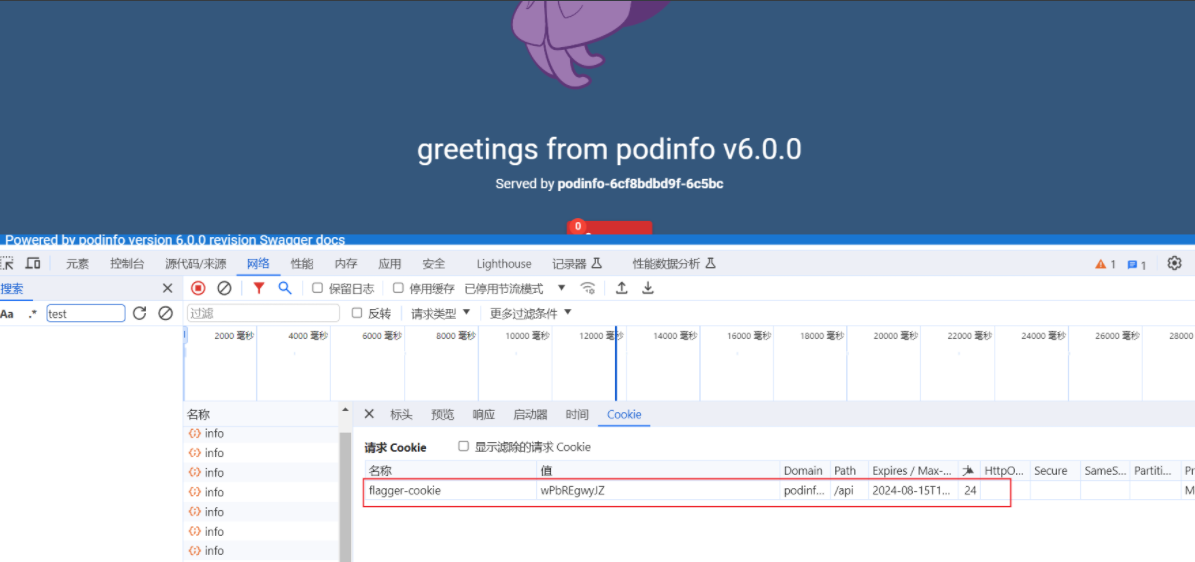
这个时候我们查看 VirtualService 对象可以发现里面就包含了会话亲和性的相关配置:
root@k8s-master01:~/istio#  kubectl get vs -ntest podinfo -oyaml
apiVersion: networking.istio.io/v1beta1
kind: VirtualService
metadata:
  name: podinfo
  namespace: test
spec:
  gateways:
  - istio-system/public-gateway
  hosts:
  - podinfo.k8s.local
  - podinfo
  http:
  - match:
    - headers:
        Cookie:
          regex: .*flagger-cookie.*tmVCwNFKaj.*
    name: sticky-route
    retries:
      attempts: 3
      perTryTimeout: 1s
      retryOn: gateway-error,connect-failure,refused-stream
    route:
    - destination:
        host: podinfo-primary
      weight: 0
    - destination:
        host: podinfo-canary
      weight: 100
  - retries:
      attempts: 3
      perTryTimeout: 1s
      retryOn: gateway-error,connect-failure,refused-stream
    route:
    - destination:
        host: podinfo-primary
      weight: 50
    - destination:
        host: podinfo-canary
      headers:
        response:
          add:
            Set-Cookie: flagger-cookie=tmVCwNFKaj; Max-Age=21600
      weight: 50
通过 VirtualService 对象将请求头中添加上 Cookie 信息,然后根据 Cookie 信息来进行路由,这样就可以实现会话亲和性了。
流量镜像
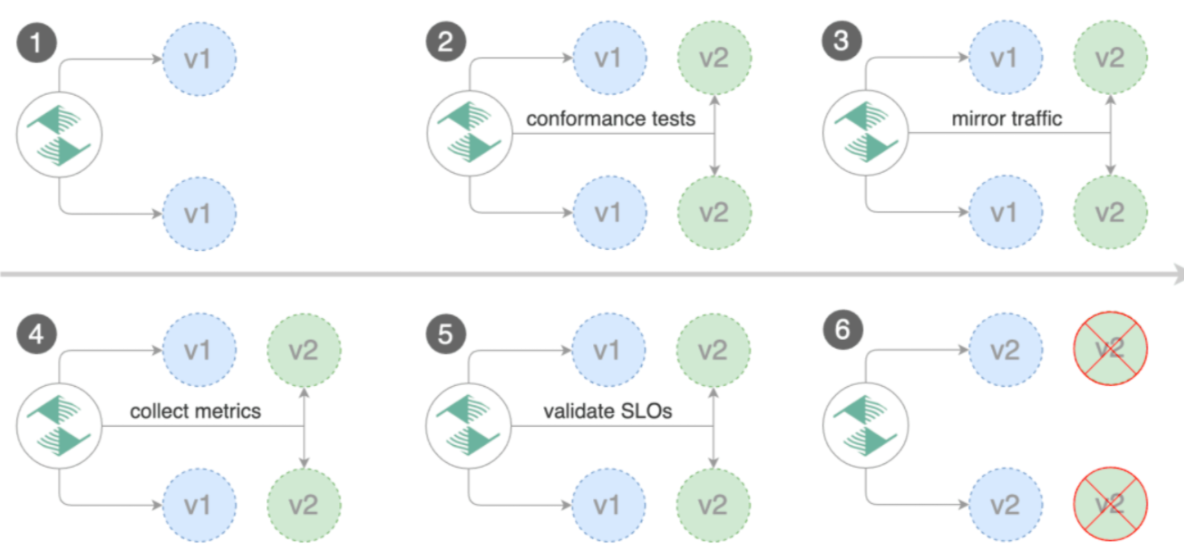
我们可以通过用迭代替换 stepWeight/maxWeight 并将 analysis.mirror 设置为 true 来启用流量镜像:
root@k8s-master01:~/istio# vim podinfo-morr.yaml
apiVersion: flagger.app/v1beta1
kind: Canary
metadata:
  name: podinfo
  namespace: test
spec:
  targetRef:
    apiVersion: apps/v1
    kind: Deployment
    name: podinfo
  progressDeadlineSeconds: 60
  autoscalerRef:
    apiVersion: autoscaling/v2
    kind: HorizontalPodAutoscaler
    name: podinfo
  service:
    port: 9898
    targetPort: 9898
    gateways:
      - istio-system/public-gateway
    hosts:
      - podinfo.k8s.local
    trafficPolicy:
      tls:
        mode: DISABLE
    retries:
      attempts: 3
      perTryTimeout: 1s
      retryOn: "gateway-error,connect-failure,refused-stream"
  analysis:
    interval: 1m
    threshold: 5
    iterations: 10       # 迭代总数
    mirror: true         # 启用流量镜像
    mirrorWeight: 100    # 将流量镜像到金丝雀版本的权重(默认为100%)
    metrics:
      - name: request-success-rate
        thresholdRange:
          min: 99
        interval: 1m
      - name: request-duration
        thresholdRange:
          max: 500
        interval: 1m
    webhooks:
      - name: acceptance-test
        type: pre-rollout
        url: http://flagger-loadtester.test/
        timeout: 30s
        metadata:
          type: bash
          cmd: "curl -sd 'test' http://podinfo-canary:9898/token | grep token"
      - name: load-test
        url: http://flagger-loadtester.test/
        timeout: 5s
        metadata:
          cmd: "hey -z 1m -q 10 -c 2 http://podinfo.test:9898/"
在上面的对象中我们增加了一个 match 字段,用于指定金丝雀匹配条件,这里我们指定了两个匹配条件,一个是 user-agent,另一个是 cookie,表示将针对 Chrome 用户和拥有 type=insider cookie 的用户运行 10 分钟的金丝雀分析。
通过上述配置,Flagger将通过以下步骤运行金丝雀版本:
-
检测新版本
-
金丝雀版本从零开始扩展
-
等待HPA设置金丝雀最小副本数检查Canary pod的健康状况运行验收测试
-
如果测试失败则中止金丝雀发布开始负载测试
-
将100%的流量从主版本镜像到金丝雀版本
-
每分钟检查请求成功率和请求持续时间
-
如果达到指标检查失败阈值,则中止金丝雀发布达到迭代次数后停止流量镜像
-
将实时流量路由到Canary Pod
-
升级金丝雀
-
等待主要部署完成
-
等待HPA设置主最小副本数
-
检查主Pod的运行状况
-
将实时流量切换回主版本
-
将金丝雀规模归零
我们可以直接更新 Canary 对象:
root@k8s-master01:~/istio# kubectl apply -f podinfo-morr.yaml
更新后我们可以重新触发金丝雀发布:
root@k8s-master01:~/istio# kubectl -n test set image deployment/podinfo podinfod=ghcr.io/stefanprodan/podinfo:6.0.1
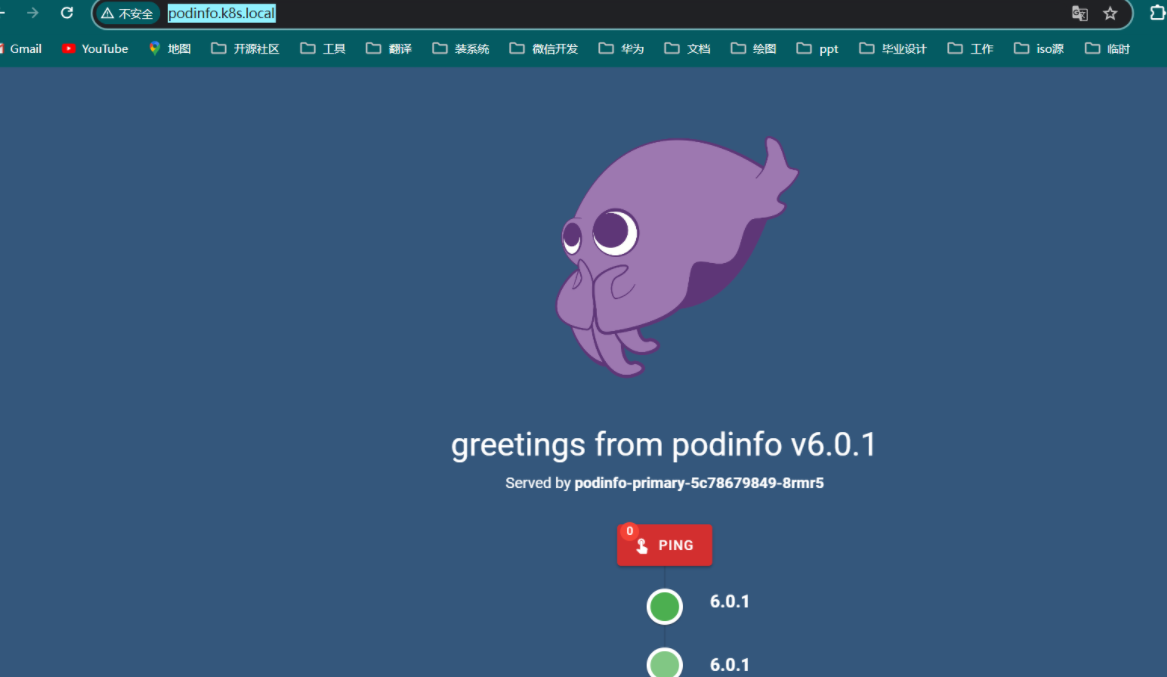
然后就会开始金丝雀发布过程了:
root@k8s-master01:~/istio# kubectl describe canary podinfo -ntest

Events:
  Type    Reason  Age                  From     Message
  ----    ------  ----                 ----     -------
  Normal  Synced  39m                  flagger  Pre-rollout check acceptance-test passed
  Normal  Synced  39m                  flagger  Advance podinfo.test canary weight 10
  Normal  Synced  38m                  flagger  Advance podinfo.test canary weight 20
  Normal  Synced  37m                  flagger  Advance podinfo.test canary weight 30
  Normal  Synced  36m                  flagger  Advance podinfo.test canary weight 40
  Normal  Synced  35m                  flagger  Advance podinfo.test canary weight 50
  Normal  Synced  34m                  flagger  Copying podinfo.test template spec to podinfo-primary.test
  Normal  Synced  32m (x2 over 33m)    flagger  (combined from similar events): Promotion completed! Scaling down podinfo.test
  Normal  Synced  2m14s (x2 over 40m)  flagger  New revision detected! Scaling up podinfo.test
  Normal  Synced  74s (x2 over 39m)    flagger  Starting canary analysis for podinfo.test
  Normal  Synced  74s                  flagger  Advance podinfo.test canary iteration 1/10
  Normal  Synced  14s                  flagger  Advance podinfo.test canary iteration 2/10
  root@k8s-master01:~/istio# kubectl get pod -n test
NAME                                 READY   STATUS    RESTARTS   AGE
flagger-loadtester-96b57bb8c-nckbt   2/2     Running   0          24h
podinfo-77495b7f4-djhsb              2/2     Running   0          2m53s
podinfo-77495b7f4-qjhzl              2/2     Running   0          2m53s
podinfo-primary-67b54c7-kmxsj        2/2     Running   0          16m
podinfo-primary-67b54c7-vrmwm        2/2     Running   0          16m
A/B 测试
接下来我们了解下如何使用 Istio 和 Flagger 进行 A/B 测试。除了加权路由之外,Flagger 还可以配置为根据 HTTP 匹配条件将流量路由到金丝雀版本,在 A/B 测试场景中,我们会使用 HTTP Header 或 cookie 来定位特定的用户群体,这对于需要会话关联的前端应用程序特别有用。
A/B 测试实验一般有 2 个目的:
-
判断哪个更好:比如在 APP 界面上做了一个新的修改,究竟效果会不会更新,需要数据来判定
-
计算收益:例如最近新上线了一个直播功能,那么直播功能究竟给平台带了来多少额外的 DAU,多少额外的使用时长,多少直播以外的视频观看时长等
我们一般比较熟知的是上述第 1 个目的,对于第 2 个目的,对于收益的量化,计算 ROI,往往对数据分析师和管理者非常重要。对于一般的 A/B 测试,其实本质上就是把平台的流量均匀分为几个组,每个组添加不同的策略,然后根据这几个组的用户数据指标,例如:留存、人均观看时长、基础互动率等等核心指标,最终选择一个最好的组上线。
所以 A/B 测试其实没有一个固定的标准,一般都是根据业务场景来定制的,比如我们可以根据用户的地域、设备、版本、渠道、用户行为等等来进行分组,然后针对不同的分组进行不同的策略,最后根据不同的指标来选择最好的组。
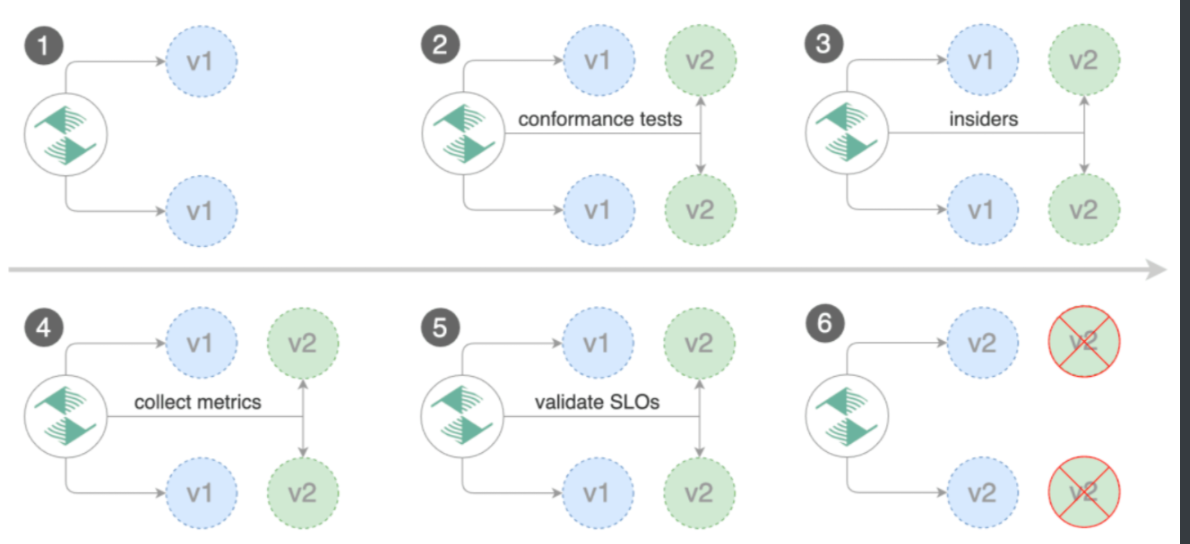
同样这里我们对上面的 podinfo 应用来进行 A/B 测试,创建一个如下所示的 Canary 对象:
root@k8s-master01:~/istio# vim podinfo-ab.yaml
apiVersion: flagger.app/v1beta1
kind: Canary
metadata:
  name: podinfo
  namespace: test
spec:
  targetRef:
    apiVersion: apps/v1
    kind: Deployment
    name: podinfo
  progressDeadlineSeconds: 60
  autoscalerRef:
    apiVersion: autoscaling/v2
    kind: HorizontalPodAutoscaler
    name: podinfo
  service:
    port: 9898
    gateways:
      - istio-system/public-gateway
    hosts:
      - podinfo.k8s.local
    trafficPolicy:
      tls:
        mode: DISABLE
  analysis:
    interval: 1m
    iterations: 10
    # 回滚前的最大失败迭代次数
    threshold: 2
    # 金丝雀匹配条件
    match:
      - headers:
          user-agent:
            regex: ".*Chrome.*"
      - headers:
          cookie:
            regex: "^(.*?;)?(type=insider)(;.*)?$"
    metrics:
      - name: request-success-rate
        thresholdRange:
          min: 99
        interval: 1m
      - name: request-duration
        thresholdRange:
          max: 500
        interval: 30s
    webhooks: # 金丝雀分析期间生成流量
      - name: load-test
        url: http://flagger-loadtester.test/
        timeout: 15s
        metadata:
          cmd: "hey -z 1m -q 10 -c 2 -H 'Cookie: type=insider' http://podinfo.test:9898/"
在上面的对象中我们增加了一个 match 字段,用于指定金丝雀匹配条件,这里我们指定了两个匹配条件,一个是 user-agent,另一个是 cookie,表示将针对 Chrome 用户和拥有 type=insider cookie 的用户运行 10 分钟的金丝雀分析。
我们可以直接更新 Canary 对象:
root@k8s-master01:~/istio# kubectl apply -f podinfo-ab.yaml
更新后我们可以重新触发金丝雀发布:
root@k8s-master01:~/istio# kubectl -n test set image deployment/podinfo podinfod=ghcr.io/stefanprodan/podinfo:6.0.2
然后就会开始金丝雀发布过程了:
root@k8s-master01:~/istio# kubectl describe canary podinfo -ntest
  Normal   Synced  10m                  flagger  Routing all traffic to primary
  Normal   Synced  2m50s (x5 over 24h)  flagger  New revision detected! Scaling up podinfo.test
  Normal   Synced  110s (x10 over 23h)  flagger  (combined from similar events): Starting canary analysis for podinfo.test
  Normal   Synced  110s (x2 over 16m)   flagger  Advance podinfo.test canary iteration 1/10
  Normal   Synced  50s (x2 over 14m)    flagger  Advance podinfo.test canary iteration 2/10

自定义指标
作为分析过程的一部分,Flagger 可以验证服务级别目标 (SLO),例如可用性、错误率百分比、平均响应时间以及基于应用程序特定指标的任何其他目标。如果在 SLO 分析过程中发现性能下降,版本将自动回滚,将对最终用户的影响降到最低。
Flagger 附带两个内置指标检查:HTTP 请求成功率和持续时间。
analysis:
  metrics:
    - name: request-success-rate
      interval: 1m
      # minimum req success rate (non 5xx responses)
      # percentage (0-100)
      thresholdRange:
        min: 99
    - name: request-duration
      interval: 1m
      # maximum req duration P99
      # milliseconds
      thresholdRange:
        max: 500
默认情况下,Flagger 使用 查询来测量请求成功率和持续时间。
在 Istio 中 HTTP 请求成功率对应的 PromQL 语句如下所示:
sum(
    rate(
        istio_requests_total{
          reporter="destination",
          destination_workload_namespace=~"{{ namespace }}",
          destination_workload=~"{{ target }}",
          response_code!~"5.*"
        }[{{ interval }}]
    )
)
/
sum(
    rate(
        istio_requests_total{
          reporter="destination",
          destination_workload_namespace=~"{{ namespace }}",
          destination_workload=~"{{ target }}"
        }[{{ interval }}]
    )
)
同样 Istio 中 HTTP 请求的持续时间对应的 PromQL 语句为:
histogram_quantile(0.99,
  sum(
    irate(
      istio_request_duration_milliseconds_bucket{
        reporter="destination",
        destination_workload=~"{{ target }}",
        destination_workload_namespace=~"{{ namespace }}"
      }[{{ interval }}]
    )
  ) by (le)
)
istio_requests_total 以及 istio_request_duration_milliseconds_bucket 这两个指标都是 Istio 自带的,前面可观测性章节中我们已经介绍过了。
如果两个内置的指标检查不足以满足需求,Flagger 还支持自定义指标检查进行扩展。使用 MetricTemplate 自定义资源,可以将 Flagger 配置为连接到指标提供程序并运行返回 float64 值的查询,查询结果用于根据指定的阈值范围验证金丝雀。
比如我们想要自定义一个 Prometheus 的指标,那么可以通过将提供程序类型设置为 prometheus 并在 PromQL 中编写查询来创建针对 Prometheus 的自定义指标检查。比如定义一个如下所示的指标模板:
apiVersion: flagger.app/v1beta1
kind: MetricTemplate
metadata:
  name: not-found-percentage
  namespace: istio-system
spec:
  provider:
    type: prometheus
    address: http://prometheus.istio-system:9090
  query: |
    100 - sum(
        rate(
            istio_requests_total{
              reporter="destination",
              destination_workload_namespace="{{ namespace }}",
              destination_workload="{{ target }}",
              response_code!="404"
            }[{{ interval }}]
        )
    )
    /
    sum(
        rate(
            istio_requests_total{
              reporter="destination",
              destination_workload_namespace="{{ namespace }}",
              destination_workload="{{ target }}"
            }[{{ interval }}]
        )
    ) * 100
然后在 Canary 对象中引用这个指标模板即可:
analysis:
  metrics:
    - name: "404s percentage"
      templateRef:
        name: not-found-percentage
        namespace: istio-system
      thresholdRange:
        max: 5
      interval: 1m

文章评论